
Sun, May 31, 2026

Volume 18, Issue 1 (Jan-Feb 2024)
mljgoums 2024, 18(1): 16-22 |
Back to browse issues page


Download citation:
BibTeX | RIS | EndNote | Medlars | ProCite | Reference Manager | RefWorks
Send citation to:


BibTeX | RIS | EndNote | Medlars | ProCite | Reference Manager | RefWorks
Send citation to:
Fayaz M, Tajari V, Taziki Balajelini M H, Rajabi A, Hosseini S M. The strong predictive role and their day-dependent behavior of blood urea nitrogen and complete blood count in covid-19’s inpatients prognosis. mljgoums 2024; 18 (1) :16-22
URL: http://mlj.goums.ac.ir/article-1-1466-en.html
URL: http://mlj.goums.ac.ir/article-1-1466-en.html
Mohammad Fayaz1 

 , Vahid Tajari2 , Mohammad Hosein Taziki Balajelini3 , Abdolhalim Rajabi4 , Seyed Mehran Hosseini5
, Vahid Tajari2 , Mohammad Hosein Taziki Balajelini3 , Abdolhalim Rajabi4 , Seyed Mehran Hosseini5
1- Department of Biostatistics, Allameh Tabataba'i University, Tehran, Iran
2- Student Research Committee, Golestan University of Medical Sciences, Gorgan, Iran
3- Department of Surgery, School of Medicine, Golestan University of Medical Sciences, Gorgan, Golestan, Iran
4- Environmental Health Research Center, Faculty of Health, Golestan University of Medical Sciences, Gorgan, Iran
5- Department of Physiology, Neuroscience Research Center, School of Medicine, Golestan University of Medical Sciences, Shastkola, Gorgan, Golestan, Iran ,hosseini@goums.ac.ir
2- Student Research Committee, Golestan University of Medical Sciences, Gorgan, Iran
3- Department of Surgery, School of Medicine, Golestan University of Medical Sciences, Gorgan, Golestan, Iran
4- Environmental Health Research Center, Faculty of Health, Golestan University of Medical Sciences, Gorgan, Iran
5- Department of Physiology, Neuroscience Research Center, School of Medicine, Golestan University of Medical Sciences, Shastkola, Gorgan, Golestan, Iran ,
Full-Text [PDF 1176 kb]
(2025 Downloads)
| Abstract (HTML) (7972 Views)
Full-Text: (1748 Views)
Introduction
The final outcome of hospitalized cases of COVID-19 may be catastrophic and is influenced by several factors, including the actual potential of health systems and the capacity of intensive care units (ICUs) (1,2).
In COVID-19, some prognostic factors are related to the patient, while others are related to the SARS-CoV-2 virus. Patient-related factors include gender, age, underlying disease, and immune status. Virus-related factors include virus variants, the initial number of viruses entering the patient's body, and the route that they enter (3-9). In severe cases, hospitalization is mandatory. The duration of hospitalization of patients is different, and its range is very wide in survived and dead cases (10-12). Predicting the severity and the course of the disease during hospitalization is very important. These predictions are usually provided based on demographic, clinical, radiological, and laboratory data. There are many reports on the role of each of these factors or a combination of them in the prognosis of hospitalized COVID-19 patients (13-17). The findings of these studies were based on the patients’ tests at admission, the patients’ condition during the hospitalization, or the patients’ information at discharge (18-23). However, most studies focused on the initial conditions of cases at admission, and the number of studies that provided statistically verified models for their data is limited (24,25). In our study, the predictive effect of demographic factors and changes in laboratory tests on the final outcome of hospitalized COVID-19 patients was studied. Indeed, the aim was to explore the best deterministic dynamic changes and the time of their occurrences during the hospitalization period that had the most predictive value for the 1-month prognosis after hospitalization of COVID-19 patients.
Methods
A total of 1982 COVID-19 patients were enrolled in this retrospective study. They were admitted to a referral university hospital in Gorgan, Iran, from 26 January 2020 to 13 January 2021. Diagnosis of COVID-19 was based on a positive SARS-CoV-2 real-time reverse transcriptase–polymerase chain reaction (RT-PCR) test (26).
Demographic, clinical, and laboratory variables were collected from the hospital information system, a formal digital registry system. For all the studied cases, the length of stay in the hospital was considered as the time interval between admission and discharge, and the patient's final condition was defined as either dead or alive. Among different variables related to the patients in the hospital, we collected demographic, clinical, and laboratory variables. The most related variables were 131 independent laboratory tests that had been measured and recorded at different hours and on different days of hospitalization from each patient. Therefore, the dataset was collected and cleaned according to considering less than 6% missing value for each variable. Thereafter, only 17 independent laboratory parameters still existed. They were white blood cell (WBC), red blood cell (RBC), hemoglobin (Hb), hematocrit, mean cell volume (MCV), mean cell hemoglobin (MCH), mean cell hemoglobin concentration (MCHC), platelet (Plt), neutrophil (Neut), eosinophil (Eos), lymphocyte (Lymph), monocyte (Mono), blood urea nitrogen (BUN), creatinine (Cr), sodium ion (Na+), potassium ion (K+), and gender. The only exclusion criterion was “more than 30 days of hospitalization.” Finally, only 1520 patients remained, of whom 232 died and 1288 survived or reached the end of 30 days. The last groups (eg, “not death and stay in the hospital after the 30 days”) were considered the right censor. The hourly observation records were not regularly observed in each hour, varied from one patient to another patient, and were sparse; therefore, we introduced 2 new indices as follows: Data preparation step 1 was averaging of all hourly measurements for each index during the hospitalization of each patient, called “total average of the index,
wherei was an index for the laboratory variables from 1 to 16, and j was an index for each measurement of the index from 1 to m i . In some analysis, we also made a daily average of each index of each patient based on the hourly observations in each day, called the “daily average of the index,

wherei n =16 j m it t T i =30 m it i t i X( i t)
Statistical methods
The descriptive statistics of demographic and clinical variables were reported as a percentage for categorical one and mean and SD for continuous one grouped by total, survived, and dead cases, respectively. The P value for testing the differences between survived and dead cases was reported with a chi-square test for categorical data and a t test or Mann-Whitney test for continuous tests. The correlation between laboratory covariates was also reported using the Pearson correlation coefficient.
The length of stay in the hospital from beginning to “at most after 30 days” was recorded for each patient with 3 statuses, including death, survived, or right censored (not death and stay in the hospital after the 30 days). Therefore, the Cox regression model was used to model the length of stay with censors and demographic and laboratory covariates. In this regard, the univariate Cox regression was fitted to each covariate separately (model 1), the multivariate Cox regression with all covariates was considered (model 2), and then the backward variable selection was used in the previous model based on the Akaike information criterion (AIC; model 3):
number of parametersk L
The generalized additive model (GAM) with the logit link function, binary response (dead and survived/still alive), and varying coefficient model were used (34,35). The covariates in the previous Cox regression models were averaged over all measurements during the length of stay in the hospital for each patient, and the averages were entered into the model. However, in the GAM, we entered the daily average of the covariates with the cubic regression spline. In this regard, 2 strategies were considered: First, the univariate GAM with only 1 daily average covariate was considered in the spline basis (A). Second, the multivariate GAM with all covariates was considered a total average, except for 1 covariate with a spline term on the daily average (B). Strategy A estimates the trends of the staying days concerning the daily average covariate within 30 days in the GAM model, and strategy B estimates the trends of the staying days for the daily average covariate adjusted by other total average covariates.
Results
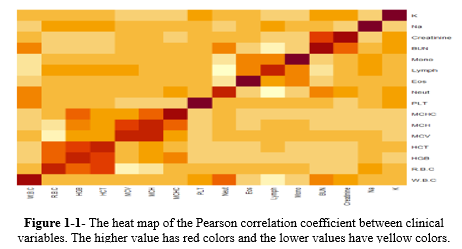
According to Table 1, of the 1520 cases, 232 (15.26%) died, and all laboratory variables were significant between the survived and dead cases (P < 0.05). Among them, WBC, MCV, Neut, BUN, Cr, Na+, and K+ had greater averages in the dead group than in the survived group. Blood urea nitrogen had a nearly double average in the dead group (44.603 ± 25.408 mg/dL) than in the survived group (21.304 ± 13.318 mg/dL); however, the Lymph count showed the opposite trend, with an average of 10.428% ± 5.524% in the dead group and 18.311% ± 8.466% in the survived group. The Pearson correlation coefficient between laboratory variables was plotted with the heat map (Figure 1-1 in the supplementary file), showing that some of them have a strong correlation (ie, HCT, HGB, and RBC).
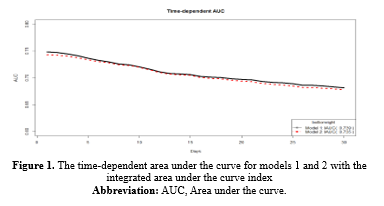
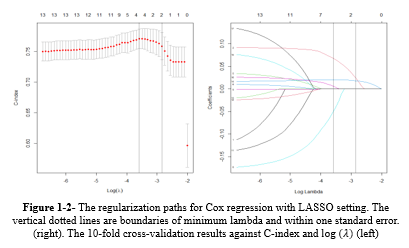
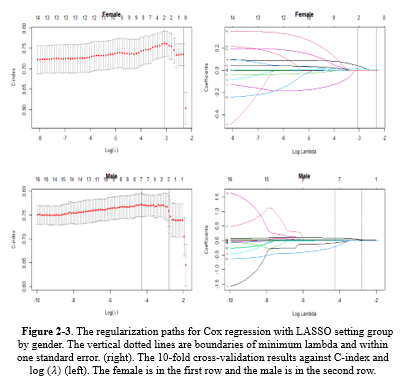
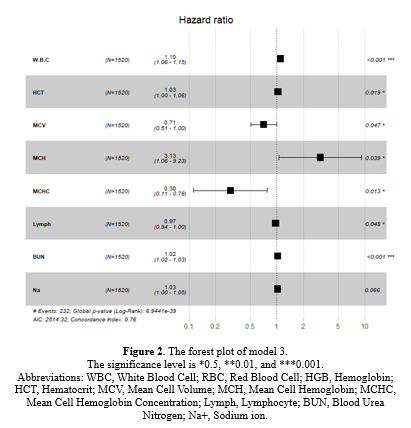
Based on Table 1-1, in model 1 or univariate Cox regressions, the calculated Hazard Ratios (HR) for K (2.31), Cr (1.424), WBC (1.177), Neut (1.102), Na (1.061), and BUN (1.03) were above 1 and showed statistical significance at 5% type I error level. In model 2 (the multivariate Cox regression), only MCH (3.363), WBC (1.069), and BUN (1.017) had estimated HR higher than 1 and were statistically significant (Table 1-1). The comparison between models 1 and 2 according to the IAUC and time-dependent AUC is illustrated in Figure 1. Both models exhibited similar performance based on the Area Under the Curve (AUC) metric, showcasing a declining trend over time with AUC values ranging between 0.68 and 0.75, indicating a high level of accuracy. Models 2 and 3 are the same; therefore, model 3 was not plotted in this figure. According to Figure 3, the estimated HRs in model 3 were all significant at 5%, except for Na+ (P = 0.066), but it remained in the model. The adjusted estimated HR for MCH was the highest among others and was 3.13 (1.06-9.23). On the other hand, WBC, MCHC, BUN, and Na+ covariates had non-zero coefficients in the LASSO Cox regression (10-fold cross-validation) with the lowest C-index (Table 1-2 and Figure 1-2).
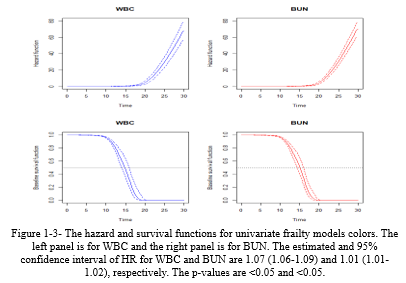
The daily stay trends of the discussed variables (WBC and BUN) were estimated and plotted in Figure 1-3, showing that the hazard function increases rapidly after 15 days.
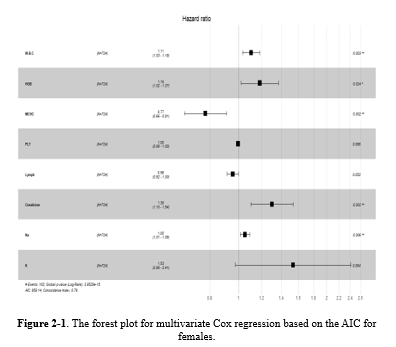
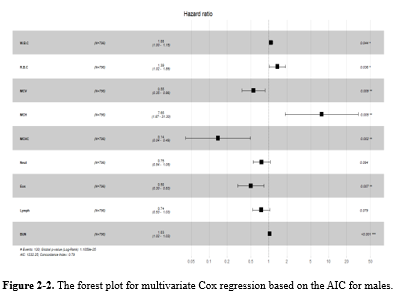
While gender did not prove to be significant in Model 3, numerous studies have highlighted the impact of demographic factors such as gender on blood-related measurements (6,8,9,34,36,37). Therefore, further analyses were repeated for each gender separately in supplementary 2 (Table 2-1: the univariate Cox regression by gender; Table 2-2: the multivariate Cox regression by gender). It showed that different variables remained in model 3, but three of them (ie, WBC [HR > 1], MCHC, and Lymph [HR < 1]) were in both models for males and females (Table 2-3, Figure 2-1, Figure 2-2, Figure 2-3, and Table 2-4).
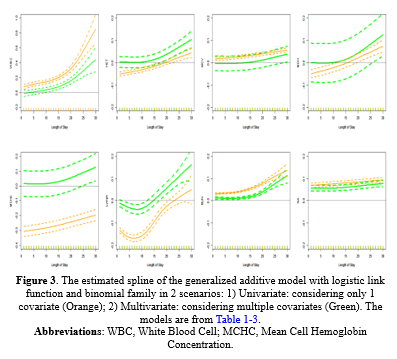
GAM Model: The estimated splines of the GAM are presented in Figure 2 for both (A) Univariate in orange and (B) multivariate in green settings. The change of the estimated splines of stay days concerning WBC and BUN from 1 to 15 days was slow but, from 15 to 30, was very rapid and rapid, respectively; in addition, the behavior of A and B was almost the same. The Lymph had a different pattern; it decreased then increased rapidly from day 5 to 10. MCHC, HCT, MCV, and MCH had a monotonic increase, but Na+ had the same estimates on all days. Table 1-3 shows the estimated coefficients and their P values.
Discussion
In addition to the previous result, the result of univariate frailty models showed the important role of complete blood cell count (CBC) and BUN in determining the prognosis of hospitalized COVID-19 patients. These data may be clinically useful. Both tests are routine and simple and almost always available. These data are especially important for patients with a hospital stay of more than 2 weeks.
In COVID-19, there is a relatively high risk of kidney involvement and acute renal failure because there are large amounts of ACE2 protein on the surface of renal epithelial cells. This protein acts as the SARS-CoV-2 receptor, and its expression in the kidney has been reported to be more than 100 times that of lung tissue (38-40). Markers of renal function are regularly reported to have a strong association with the deterioration or death in COVID-19 patients. In the study by Ok et al, 139 patients were studied. BUN/Cr and neutrophil-to-lymphocyte ratios (NLRs) at admission were reported as 2 independent predictors of disease severity and death (41). In the study by Cheng et al, 305 patients were examined. In this study, the level of BUN and D dimer at admission had a strong relationship with the mortality rate of patients. In Cox regression analysis, the role of these 2 factors as 2 independent factors in determining the prognosis was identified. In other words, even after adjustment for the effect of age, sex, underlying disease, neutrophilia, lymphocytopenia, thrombocytopenia, albumin, lactate dehydrogenase, procalcitonin, and interleukin 6 (IL-6), the 2 factors were strongly associated with COVID-19 mortality (42). The importance of BUN as an independent factor in predicting patient mortality and also as a marker of disease severity has previously been reported in different diseases (43). In a study of 4176 ICU patients, the level of BUN at admission was associated with patient mortality. This finding was still present even after correcting the BUN value based on other confounding variables, including the extent of renal failure (44). In fact, the relationship between BUN (as an independent factor but unrelated to kidney function) and prognosis has been reported in various diseases. This relationship has been reported in all 3 timing states: the level at the beginning of hospitalization, the increasing trend during hospitalization, and the level of BUN at the end of hospitalization or discharge. The association of increased BUN with mortality has been reported for acute heart failure, gastrointestinal bleeding, acute pancreatitis, pulmonary embolism, aspiration pneumonia, nosocomial and community-acquired pneumonia; in addition, it was associated with the risk of developing diabetes (45-55). Regarding the predictive role of BUN in COVID-19, 3 possible mechanisms have been proposed: 1) direct kidney involvement and virus invasion of kidney tissue, 2) hypoxic renal damage due to pulmonary involvement and hypoperfusion due to hypovolemia or heart involvement, and 3) septic and another type of shock and organ failure (56-62).
This study has some limitations. It was a retrospective study, and all data were limited to a referral university hospital. We included only cases with 30 days of hospitalization. We did not consider the time lag between the start of symptoms and hospitalization.
Conclusion
Blood urea nitrogen and CBC provide strong predictive clues about the prognosis of hospitalized COVID-19 patients, and rapid dynamic changes in the second week can predict a poor outcome in these patients.
Acknowledgement
This study was performed at Golestan University of Medical Sciences. Sincere thanks are given to all patients who participated in the study.
Funding sources
This work was financially supported by grant No. 111563 from Golestan University of Medical Sciences. The funding agency had no role in the study design, data collection, analysis, and interpretation, or the decision to submit the article for publication.
Ethical statement
This observational study was approved by the Ethics Committee of Golestan University of Medical Sciences, Gorgan, Iran
(Code: IR.GOUMS.REC.1399.031).
Conflicts of interest
The authors declare that they have no competing interests.
Author contributions
MF, MHTB, SMH, and AT designed the study. MHTB and AR collected data. MF, SMH, and AR analyzed data. MHTB, MF, VT and SMH prepared the manuscript. All authors read and approved the final manuscript.
The final outcome of hospitalized cases of COVID-19 may be catastrophic and is influenced by several factors, including the actual potential of health systems and the capacity of intensive care units (ICUs) (1,2).
In COVID-19, some prognostic factors are related to the patient, while others are related to the SARS-CoV-2 virus. Patient-related factors include gender, age, underlying disease, and immune status. Virus-related factors include virus variants, the initial number of viruses entering the patient's body, and the route that they enter (3-9). In severe cases, hospitalization is mandatory. The duration of hospitalization of patients is different, and its range is very wide in survived and dead cases (10-12). Predicting the severity and the course of the disease during hospitalization is very important. These predictions are usually provided based on demographic, clinical, radiological, and laboratory data. There are many reports on the role of each of these factors or a combination of them in the prognosis of hospitalized COVID-19 patients (13-17). The findings of these studies were based on the patients’ tests at admission, the patients’ condition during the hospitalization, or the patients’ information at discharge (18-23). However, most studies focused on the initial conditions of cases at admission, and the number of studies that provided statistically verified models for their data is limited (24,25). In our study, the predictive effect of demographic factors and changes in laboratory tests on the final outcome of hospitalized COVID-19 patients was studied. Indeed, the aim was to explore the best deterministic dynamic changes and the time of their occurrences during the hospitalization period that had the most predictive value for the 1-month prognosis after hospitalization of COVID-19 patients.
Methods
A total of 1982 COVID-19 patients were enrolled in this retrospective study. They were admitted to a referral university hospital in Gorgan, Iran, from 26 January 2020 to 13 January 2021. Diagnosis of COVID-19 was based on a positive SARS-CoV-2 real-time reverse transcriptase–polymerase chain reaction (RT-PCR) test (26).
Demographic, clinical, and laboratory variables were collected from the hospital information system, a formal digital registry system. For all the studied cases, the length of stay in the hospital was considered as the time interval between admission and discharge, and the patient's final condition was defined as either dead or alive. Among different variables related to the patients in the hospital, we collected demographic, clinical, and laboratory variables. The most related variables were 131 independent laboratory tests that had been measured and recorded at different hours and on different days of hospitalization from each patient. Therefore, the dataset was collected and cleaned according to considering less than 6% missing value for each variable. Thereafter, only 17 independent laboratory parameters still existed. They were white blood cell (WBC), red blood cell (RBC), hemoglobin (Hb), hematocrit, mean cell volume (MCV), mean cell hemoglobin (MCH), mean cell hemoglobin concentration (MCHC), platelet (Plt), neutrophil (Neut), eosinophil (Eos), lymphocyte (Lymph), monocyte (Mono), blood urea nitrogen (BUN), creatinine (Cr), sodium ion (Na+), potassium ion (K+), and gender. The only exclusion criterion was “more than 30 days of hospitalization.” Finally, only 1520 patients remained, of whom 232 died and 1288 survived or reached the end of 30 days. The last groups (eg, “not death and stay in the hospital after the 30 days”) were considered the right censor. The hourly observation records were not regularly observed in each hour, varied from one patient to another patient, and were sparse; therefore, we introduced 2 new indices as follows: Data preparation step 1 was averaging of all hourly measurements for each index during the hospitalization of each patient, called “total average of the index,
where
where
Statistical methods
The descriptive statistics of demographic and clinical variables were reported as a percentage for categorical one and mean and SD for continuous one grouped by total, survived, and dead cases, respectively. The P value for testing the differences between survived and dead cases was reported with a chi-square test for categorical data and a t test or Mann-Whitney test for continuous tests. The correlation between laboratory covariates was also reported using the Pearson correlation coefficient.
The length of stay in the hospital from beginning to “at most after 30 days” was recorded for each patient with 3 statuses, including death, survived, or right censored (not death and stay in the hospital after the 30 days). Therefore, the Cox regression model was used to model the length of stay with censors and demographic and laboratory covariates. In this regard, the univariate Cox regression was fitted to each covariate separately (model 1), the multivariate Cox regression with all covariates was considered (model 2), and then the backward variable selection was used in the previous model based on the Akaike information criterion (AIC; model 3):
number of parameters
The generalized additive model (GAM) with the logit link function, binary response (dead and survived/still alive), and varying coefficient model were used (34,35). The covariates in the previous Cox regression models were averaged over all measurements during the length of stay in the hospital for each patient, and the averages were entered into the model. However, in the GAM, we entered the daily average of the covariates with the cubic regression spline. In this regard, 2 strategies were considered: First, the univariate GAM with only 1 daily average covariate was considered in the spline basis (A). Second, the multivariate GAM with all covariates was considered a total average, except for 1 covariate with a spline term on the daily average (B). Strategy A estimates the trends of the staying days concerning the daily average covariate within 30 days in the GAM model, and strategy B estimates the trends of the staying days for the daily average covariate adjusted by other total average covariates.
Results
According to Table 1, of the 1520 cases, 232 (15.26%) died, and all laboratory variables were significant between the survived and dead cases (P < 0.05). Among them, WBC, MCV, Neut, BUN, Cr, Na+, and K+ had greater averages in the dead group than in the survived group. Blood urea nitrogen had a nearly double average in the dead group (44.603 ± 25.408 mg/dL) than in the survived group (21.304 ± 13.318 mg/dL); however, the Lymph count showed the opposite trend, with an average of 10.428% ± 5.524% in the dead group and 18.311% ± 8.466% in the survived group. The Pearson correlation coefficient between laboratory variables was plotted with the heat map (Figure 1-1 in the supplementary file), showing that some of them have a strong correlation (ie, HCT, HGB, and RBC).
Table 1. The descriptive statistics of the demographic and clinical characteristics |
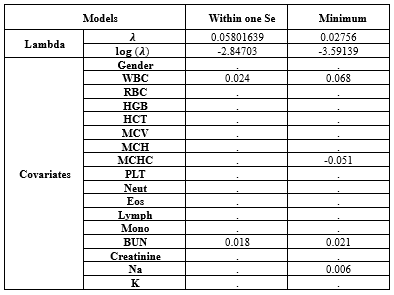
Based on Table 1-1, in model 1 or univariate Cox regressions, the calculated Hazard Ratios (HR) for K (2.31), Cr (1.424), WBC (1.177), Neut (1.102), Na (1.061), and BUN (1.03) were above 1 and showed statistical significance at 5% type I error level. In model 2 (the multivariate Cox regression), only MCH (3.363), WBC (1.069), and BUN (1.017) had estimated HR higher than 1 and were statistically significant (Table 1-1). The comparison between models 1 and 2 according to the IAUC and time-dependent AUC is illustrated in Figure 1. Both models exhibited similar performance based on the Area Under the Curve (AUC) metric, showcasing a declining trend over time with AUC values ranging between 0.68 and 0.75, indicating a high level of accuracy. Models 2 and 3 are the same; therefore, model 3 was not plotted in this figure. According to Figure 3, the estimated HRs in model 3 were all significant at 5%, except for Na+ (P = 0.066), but it remained in the model. The adjusted estimated HR for MCH was the highest among others and was 3.13 (1.06-9.23). On the other hand, WBC, MCHC, BUN, and Na+ covariates had non-zero coefficients in the LASSO Cox regression (10-fold cross-validation) with the lowest C-index (Table 1-2 and Figure 1-2).
Table 1-1. The ANOVA table of Cox regression models group by model strategy including univariate (1), multivariate (2), and AIC selection (3).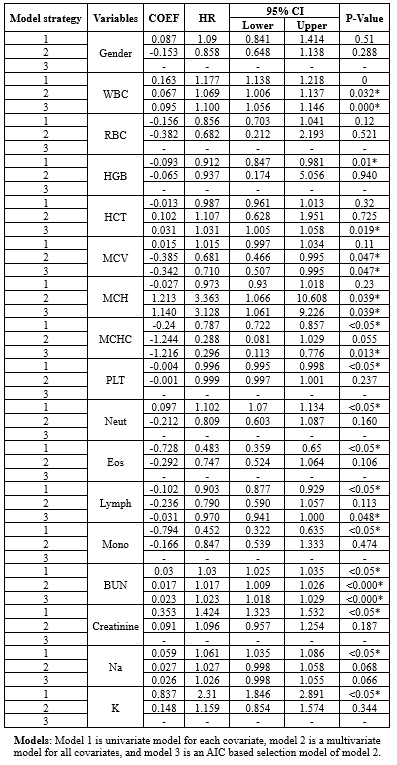 |
|
Table 1-2. The estimated covariates of Cox regression in minimum λ and within one standard error
 |
The daily stay trends of the discussed variables (WBC and BUN) were estimated and plotted in Figure 1-3, showing that the hazard function increases rapidly after 15 days.
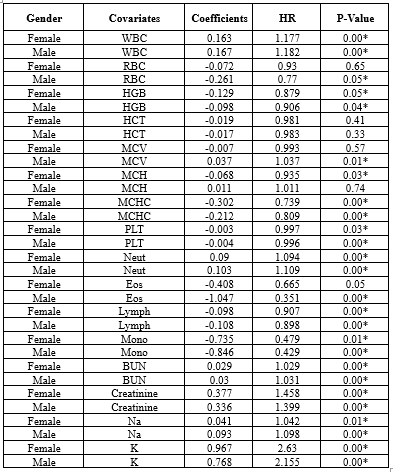
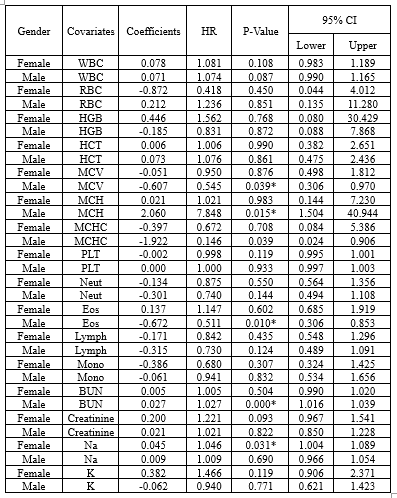
While gender did not prove to be significant in Model 3, numerous studies have highlighted the impact of demographic factors such as gender on blood-related measurements (6,8,9,34,36,37). Therefore, further analyses were repeated for each gender separately in supplementary 2 (Table 2-1: the univariate Cox regression by gender; Table 2-2: the multivariate Cox regression by gender). It showed that different variables remained in model 3, but three of them (ie, WBC [HR > 1], MCHC, and Lymph [HR < 1]) were in both models for males and females (Table 2-3, Figure 2-1, Figure 2-2, Figure 2-3, and Table 2-4).
GAM Model: The estimated splines of the GAM are presented in Figure 2 for both (A) Univariate in orange and (B) multivariate in green settings. The change of the estimated splines of stay days concerning WBC and BUN from 1 to 15 days was slow but, from 15 to 30, was very rapid and rapid, respectively; in addition, the behavior of A and B was almost the same. The Lymph had a different pattern; it decreased then increased rapidly from day 5 to 10. MCHC, HCT, MCV, and MCH had a monotonic increase, but Na+ had the same estimates on all days. Table 1-3 shows the estimated coefficients and their P values.
|
Table 2-2. The estimated Multivariate Cox Regression group by Gender
 |
|
Table 2-3. The estimated multivariate Cox Regression with backward selection based on AIC group by Gender
 |
|
Table 2-4. The estimated coefficients of Cox regression in minimum λ and within one standard error group by Gender
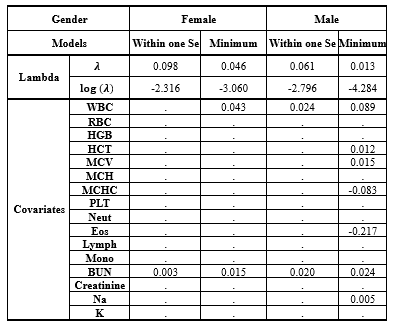 |
Table 1-3. The comparison between 8 models with considering generalized additive model with logistic link function and binomial family group by (A) Univariate and (B) Multivariate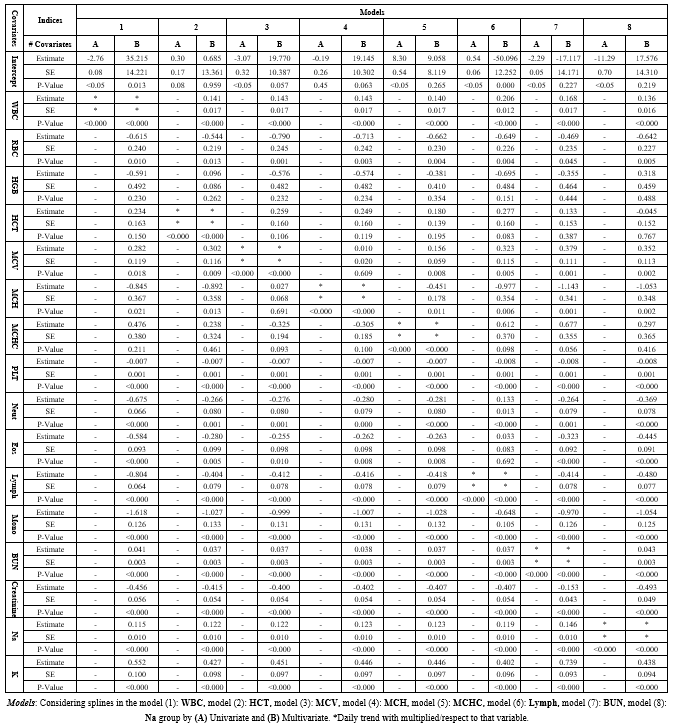 |
Discussion
In addition to the previous result, the result of univariate frailty models showed the important role of complete blood cell count (CBC) and BUN in determining the prognosis of hospitalized COVID-19 patients. These data may be clinically useful. Both tests are routine and simple and almost always available. These data are especially important for patients with a hospital stay of more than 2 weeks.
In COVID-19, there is a relatively high risk of kidney involvement and acute renal failure because there are large amounts of ACE2 protein on the surface of renal epithelial cells. This protein acts as the SARS-CoV-2 receptor, and its expression in the kidney has been reported to be more than 100 times that of lung tissue (38-40). Markers of renal function are regularly reported to have a strong association with the deterioration or death in COVID-19 patients. In the study by Ok et al, 139 patients were studied. BUN/Cr and neutrophil-to-lymphocyte ratios (NLRs) at admission were reported as 2 independent predictors of disease severity and death (41). In the study by Cheng et al, 305 patients were examined. In this study, the level of BUN and D dimer at admission had a strong relationship with the mortality rate of patients. In Cox regression analysis, the role of these 2 factors as 2 independent factors in determining the prognosis was identified. In other words, even after adjustment for the effect of age, sex, underlying disease, neutrophilia, lymphocytopenia, thrombocytopenia, albumin, lactate dehydrogenase, procalcitonin, and interleukin 6 (IL-6), the 2 factors were strongly associated with COVID-19 mortality (42). The importance of BUN as an independent factor in predicting patient mortality and also as a marker of disease severity has previously been reported in different diseases (43). In a study of 4176 ICU patients, the level of BUN at admission was associated with patient mortality. This finding was still present even after correcting the BUN value based on other confounding variables, including the extent of renal failure (44). In fact, the relationship between BUN (as an independent factor but unrelated to kidney function) and prognosis has been reported in various diseases. This relationship has been reported in all 3 timing states: the level at the beginning of hospitalization, the increasing trend during hospitalization, and the level of BUN at the end of hospitalization or discharge. The association of increased BUN with mortality has been reported for acute heart failure, gastrointestinal bleeding, acute pancreatitis, pulmonary embolism, aspiration pneumonia, nosocomial and community-acquired pneumonia; in addition, it was associated with the risk of developing diabetes (45-55). Regarding the predictive role of BUN in COVID-19, 3 possible mechanisms have been proposed: 1) direct kidney involvement and virus invasion of kidney tissue, 2) hypoxic renal damage due to pulmonary involvement and hypoperfusion due to hypovolemia or heart involvement, and 3) septic and another type of shock and organ failure (56-62).
This study has some limitations. It was a retrospective study, and all data were limited to a referral university hospital. We included only cases with 30 days of hospitalization. We did not consider the time lag between the start of symptoms and hospitalization.
Conclusion
Blood urea nitrogen and CBC provide strong predictive clues about the prognosis of hospitalized COVID-19 patients, and rapid dynamic changes in the second week can predict a poor outcome in these patients.
Acknowledgement
This study was performed at Golestan University of Medical Sciences. Sincere thanks are given to all patients who participated in the study.
Funding sources
This work was financially supported by grant No. 111563 from Golestan University of Medical Sciences. The funding agency had no role in the study design, data collection, analysis, and interpretation, or the decision to submit the article for publication.
Ethical statement
This observational study was approved by the Ethics Committee of Golestan University of Medical Sciences, Gorgan, Iran
(Code: IR.GOUMS.REC.1399.031).
Conflicts of interest
The authors declare that they have no competing interests.
Author contributions
MF, MHTB, SMH, and AT designed the study. MHTB and AR collected data. MF, SMH, and AR analyzed data. MHTB, MF, VT and SMH prepared the manuscript. All authors read and approved the final manuscript.
Research Article: Original Paper |
Subject:
Virology
Received: 2021/12/12 | Accepted: 2023/09/9 | Published: 2024/01/22 | ePublished: 2024/01/22
Received: 2021/12/12 | Accepted: 2023/09/9 | Published: 2024/01/22 | ePublished: 2024/01/22
References
1. Sprung CL, Joynt GM, Christian MD, Truog RD, Rello J, Nates JL. Adult ICU Triage During the Coronavirus Disease 2019 Pandemic: Who Will Live and Who Will Die? Recommendations to Improve Survival. Crit Care Med. 2020;48(8):1196-1202. [View at Publisher] [DOI] [PMID] [Google Scholar]
2. Aziz S, Arabi YM, Alhazzani W, Evans L, Citerio G, Fischkoff K, et al. Managing ICU surge during the COVID-19 crisis: rapid guidelines. Intensive Care Med. 2020;46(7):1303-25. [View at Publisher] [DOI:10.1007/s00134-020-06092-5] [PMID] [Google Scholar]
3. Li X, Xu S, Yu M, Wang K, Tao Y, Zhou Y, et al. Risk factors for severity and mortality in adult COVID-19 inpatients in Wuhan. J Allergy Clin Immunol. 2020;146(1):110-118. [View at Publisher] [Google Scholar] [DOI] [PMID] [View at Publisher] [DOI] [PMID] [Google Scholar]
4. Weiss P, Murdoch DR. Clinical course and mortality risk of severe COVID-19. Lancet. 2020;395(10229):1014-5. [View at Publisher] [DOI] [PMID] [Google Scholar]
5. Albitar O, Ballouze R, Ooi JP, Sheikh Ghadzi SM. Risk factors for mortality among COVID-19 patients. Diabetes Res Clin Pract. 2020;166:108293. [View at Publisher] [DOI] [PMID] [Google Scholar]
6. Zheng Z, Peng F, Xu B, Zhao J, Liu H, Peng J, Li Q, Jiang C, Zhou Y, Liu S, Ye C, Zhang P, Xing Y, Guo H, Tang W. Risk factors of critical & mortal COVID-19 cases: A systematic literature review and meta-analysis. J Infect. 2020;81(2):e16-25. [View at Publisher] [DOI] [PMID] [Google Scholar]
7. Izcovich A, Ragusa MA, Tortosa F, Lavena Marzio MA, Agnoletti C, Bengolea A, et al. Prognostic factors for severity and mortality in patients infected with COVID-19: A systematic review. PLoS One. 2020;15(11):e0241955. [View at Publisher] [DOI] [PMID] [Google Scholar]
8. Kadam SB, Sukhramani GS, Bishnoi P, Pable AA, Barvkar VT. SARS-CoV-2, the pandemic coronavirus: Molecular and structural insights. J Basic Microbiol. 2021;61(3):180-202. [View at Publisher] [DOI] [PMID] [Google Scholar]
9. Kandeel M, Ibrahim A, Fayez M, Al-Nazawi M. From SARS and MERS CoVs to SARS-CoV-2: Moving toward more biased codon usage in viral structural and nonstructural genes. J Med Virol. 2020; 92(6): 660-6. [View at Publisher] [DOI] [PMID] [Google Scholar]
10. Chen J, Qi T, Liu L, Ling Y, Qian Z, Li T, et al. Clinical progression of patients with COVID-19 in Shanghai, China. J Infect. 2020;80(5):e1-6. [View at Publisher] [DOI] [PMID] [Google Scholar]
11. Xu J, Yang X, Yang L, Zou X, Wang Y, Wu Y, et al. Clinical course and predictors of 60-day mortality in 239 critically ill patients with COVID-19: a multicenter retrospective study from Wuhan, China. Crit Care. 2020;24(1):394. [View at Publisher] [DOI] [PMID] [Google Scholar]
12. Argenziano MG, Bruce SL, Slater CL, Tiao JR, Baldwin MR, Barr RG, et al. Characterization and clinical course of 1000 patients with coronavirus disease 2019 in New York: retrospective case series. BMJ. 2020; 369: m1996. [View at Publisher] [DOI] [PMID] [Google Scholar]
13. Gatti M, Calandri M, Biondo A, Geninatti C, Piatti C, Ruggirello I, et al. Emergency room comprehensive assessment of demographic, radiological, laboratory and clinical data of patients with COVID-19: determination of its prognostic value for in-hospital mortality. Intern Emerg Med. 2022;17(1):205-14. [View at Publisher] [DOI] [PMID] [Google Scholar]
14. Xu PP, Tian RH, Luo S, Zu ZY, Fan B, Wang XM, et al. Risk factors for adverse clinical outcomes with COVID-19 in China: a multicenter, retrospective, observational study. Theranostics. 2020;10(14):6372-83. [View at Publisher] [DOI] [PMID] [Google Scholar]
15. Alhumaid S, Al Mutair A, Al Alawi Z, Al Salman K, Al Dossary N, Omar A, et al. Clinical features and prognostic factors of intensive and non-intensive 1014 COVID-19 patients: an experience cohort from Alahsa, Saudi Arabia. Eur J Med Res. 2021;26(1):47. [View at Publisher] [DOI] [PMID] [Google Scholar]
16. SeyedAlinaghi S, Abbasian L, Solduzian M, Ayoobi Yazdi N, Jafari F, Adibimehr A, et al. Predictors of the prolonged recovery period in COVID-19 patients: a cross-sectional study. Eur J Med Res. 2021;26(1):41. [View at Publisher] [DOI] [PMID] [Google Scholar]
17. Bai B, Xu Z, Hu Y, Qu M, Cheng J, Luo S, et al. Patient hematology during hospitalization for viral pneumonia caused by SARS-CoV-2 and non-SARS-CoV-2 agents: a retrospective study. Eur J Med Res. 2021;26(1):45. [View at Publisher] [DOI] [PMID] [Google Scholar]
18. Leeuwenberg AM, Schuit E. Prediction models for COVID-19 clinical decision making. Lancet Digit Health. 2020;2(10):e496-7. [View at Publisher] [DOI] [PMID] [Google Scholar]
19. Wynants L, Van Calster B, Collins GS, Riley RD, Heinze G, Schuit E, et al. Prediction models for diagnosis and prognosis of covid-19: systematic review and critical appraisal. BMJ. 2020;369:m1328. [View at Publisher] [DOI] [PMID] [Google Scholar]
20. Pranata R, Henrina J, Lim MA, Lawrensia S, Yonas E, Vania R, et al. Clinical frailty scale and mortality in COVID-19: A systematic review and dose-response meta-analysis. Arch Gerontol Geriatr. 2021;93:104324. [View at Publisher] [DOI] [PMID] [Google Scholar]
21. Zeng F, Deng G, Cui Y, Zhang Y, Dai M, Chen L, et al. A predictive model for the severity of COVID-19 in elderly patients. Aging (Albany NY). 2020; 12(21): 20982-96. [View at Publisher] [DOI] [PMID] [Google Scholar]
22. Dong Y, Zhou H, Li M, Zhang Z, Guo W, Yu T, et al. A novel simple scoring model for predicting severity of patients with SARS-CoV-2 infection. Transbound Emerg Dis. 2020;67(6):2823-9. [View at Publisher] [DOI] [PMID] [Google Scholar]
23. Badal S, Thapa Bajgain K, Badal S, Thapa R, Bajgain BB, Santana MJ. Prevalence, clinical characteristics, and outcomes of pediatric COVID-19: A systematic review and meta-analysis. J Clin Virol. 2021;135:104715. [View at Publisher] [DOI] [PMID] [Google Scholar]
24. Castro VM, McCoy TH, Perlis RH. Laboratory Findings Associated With Severe Illness and Mortality Among Hospitalized Individuals With Coronavirus Disease 2019 in Eastern Massachusetts. JAMA Netw Open. 2020;3(10):e2023934. [View at Publisher] [DOI] [PMID] [Google Scholar]
25. Bertsimas D, Lukin G, Mingardi L, Nohadani O, Orfanoudaki A, Stellato B, et al. COVID-19 Study Group. COVID-19 mortality risk assessment: An international multi-center study. PLoS One. 2020;15(12):e0243262. [View at Publisher] [DOI] [PMID] [Google Scholar]
26. Tang Y-W, Schmitz JE, Persing DH, Stratton CW. Laboratory diagnosis of COVID-19: current issues and challenges. Journal of clinical microbiology. 2020;58(6). [View at Publisher] [DOI] [PMID] [Google Scholar]
27. R Core Team. R: A Language and Environment for Statistical Computing, R Foundation for Statistical Computing, Vienna, Austria. 2020. [View at Publisher] [Google Scholar]
28. Kleinbaum DG, Klein M. Survival analysis. 3rd ed.Vol3. New York:Springer;2010. [View at Publisher] [Google Scholar] [View at Publisher] [Google Scholar]
29. Kassambara A, Kosinski M, Biecek P, Fabian S. Package 'survminer'. Drawing Survival Curves using 'ggplot2'(R package version 03 1). 2017. [View at Publisher] [Google Scholar] [View at Publisher] [Google Scholar]
30. Simon N, Friedman J, Hastie T, Tibshirani R. Regularization paths for Cox's proportional hazards model via coordinate descent. J Stat Softw. 2011;39(5):1-13. [View at Publisher] [DOI:10.18637/jss.v039.i05] [PMID] [Google Scholar]
31. Rondeau V, Mazroui Y, Gonzalez JR. frailtypack: an R package for the analysis of correlated survival data with frailty models using penalized likelihood estimation or parametrical estimation. J Stat Softw. 2012;47(4):1-28. [View at Publisher] [DOI] [Google Scholar]
32. Song Xiao, and Xiao-Hua Zhou. A semiparametric approach for the covariate specific ROC curve with survival outcome. Statistica Sinica. 2008;18(3):947-65. [View at Publisher] [Google Scholar]
33. Schmid M, Potapov S, Adler W. survAUC: Estimators of Prediction Accuracy for Time-to-Event Data. The R User Conference, useR! UK: University of Warwick, Coventry;2011. [View at Publisher] [Google Scholar]
34. Assaf S, Campostrini S. Application of the varying coefficient model to the behaviour risk factor surveillance data in Italy: a study of changing smoking prevalence among sub-populations. BMC Public Health. 2015;15(1):489. [View at Publisher] [Google Scholar] [DOI] [PMID] [View at Publisher] [DOI] [PMID] [Google Scholar]
35. Wood SN. Generalized additive models: an introduction with R. 2nd ed. Boca Raton:CRC press;2017. 496p. [View at Publisher] [Google Scholar] [DOI] [View at Publisher] [Google Scholar]
36. Ataei N, Hosseini M, Fayaz M, Navidi I, Taghiloo A, Kalantari K, et al. Blood pressure percentiles by age and height for children and adolescents in Tehran, Iran. J Hum hypertens. 2016;30(4):268-77. [View at Publisher] [DOI] [PMID] [Google Scholar]
37. Park SH, Park CJ, Lee BR, Kim MJ, Han MY, Cho YU, et al. Establishment of age-and gender-specific reference ranges for 36 routine and 57 cell population data items in a new automated blood cell analyzer, Sysmex XN-2000. Ann Lab Med. 2016;36(3):244-9. [View at Publisher] [DOI] [PMID] [Google Scholar]
38. Zhou P, Yang XL, Wang XG, Hu B, Zhang L, Zhang W, et al. A pneumonia outbreak associated with a new coronavirus of probable bat origin. Nature. 2020;579(7798):270-3. [View at Publisher] [Google Scholar]
39. Li Z, Wu M, Yao J, Guo J, Liao X, Song S, et al. Caution on Kidney Dysfunctions of COVID-19 Patients. medRxiv. PPR:PPR112604. [View at Publisher] [DOI] [View at Publisher]
40. Cheng Y, Luo R, Wang K, Zhang M, Wang Z, Dong L, et al. Kidney disease is associated with in-hospital death of patients with COVID-19. Kidney Int. 2020;97(5):829-838. [View at Publisher] [DOI] [PMID] [Google Scholar]
41. Ok F, Erdogan O, Durmus E, Carkci S, Canik A. Predictive values of blood urea nitrogen/creatinine ratio and other routine blood parameters on disease severity and survival of COVID-19 patients. J Med Virol. 2021;93(2):786-93. [View at Publisher] [DOI] [PMID] [Google Scholar]
42. Cheng A, Hu L, Wang Y, Huang L, Zhao L, Zhang C, et al. Diagnostic performance of initial blood urea nitrogen combined with D-dimer levels for predicting in-hospital mortality in COVID-19 patients. Int J Antimicrob Agents. 2020;56(3):106110. [View at Publisher] [Google Scholar] [DOI] [PMID] [View at Publisher] [DOI] [PMID] [Google Scholar]
43. Wernly B, Lichtenauer M, Vellinga NAR, Boerma EC, Ince C, Kelm M, et al. Blood urea nitrogen (BUN) independently predicts mortality in critically ill patients admitted to ICU: A multicenter study. Clin Hemorheol Microcirc. 2018;69(1-2):123-31. [View at Publisher] [DOI] [PMID] [Google Scholar]
44. Arihan O, Wernly B, Lichtenauer M, Franz M, Kabisch B, Muessig J, et al. Blood urea nitrogen (BUN) is independently associated with mortality in critically ill patients admitted to ICU. PLoS One. 2018;13(1):e0191697. [View at Publisher] [DOI] [PMID] [Google Scholar]
45. Miura M, Sakata Y, Nochioka K, Takahashi J, Takada T, Miyata S, et al. Prognostic impact of blood urea nitrogen changes during hospitalization in patients with acute heart failure syndrome. Circ J. 2013;77(5):1221-8. [View at Publisher] [DOI] [PMID] [Google Scholar]
46. Xie Y, Bowe B, Li T, Xian H, Yan Y, Al-Aly Z. Higher blood urea nitrogen is associated with increased risk of incident diabetes mellitus. Kidney Int. 2018;93(3):741-52. [View at Publisher] [DOI] [PMID] [Google Scholar]
47. Wu KH, Shih HA, Hung MS, Hsiao CT, Chen YC. The association between blood urea nitrogen to creatinine ratio and mortality in patients with upper gastrointestinal bleeding. Arab J Gastroenterol. 2018;19(4):143-7. [View at Publisher] [DOI] [PMID] [Google Scholar]
48. Lin S, Hong W, Basharat Z, Wang Q, Pan J, Zhou M. Blood Urea Nitrogen as a Predictor of Severe Acute Pancreatitis Based on the Revised Atlanta Criteria: Timing of Measurement and Cutoff Points. Can J Gastroenterol Hepatol. 2017;2017:9592831. [View at Publisher] [DOI] [PMID] [Google Scholar]
49. Tatlisu MA, Kaya A, Keskin M, Avsar S, Bozbay M, Tatlisu K, et al. The association of blood urea nitrogen levels with mortality in acute pulmonary embolism. J Crit Care. 2017;39:248-53. [View at Publisher] [DOI] [PMID] [Google Scholar]
50. Kazory A . Emergence of blood urea nitrogen as a biomarker of neurohormonal activation in heart failure. Am J Cardiol. 2010;106(5):694-700. [View at Publisher] [DOI] [PMID] [Google Scholar]
51. Aronson D, Mittleman MA, Burger AJ. Elevated blood urea nitrogen level as a predictor of mortality in patients admitted for decompensated heart failure. Am J Med. 2004;116(7):466-73. [View at Publisher] [DOI] [PMID] [Google Scholar]
52. Feng DY, Zhou YQ, Zou XL, Zhou M, Yang HL, Chen XX, et al. Elevated blood urea nitrogen-to-serum albumin ratio as a factor that negatively affects the mortality of patients with hospital-acquired pneumonia. Can J Infect Dis Med Microbiol. 2019;2019:1547405. [View at Publisher] [DOI] [PMID] [Google Scholar]
53. Tokgoz Akyil F, Yalcinsoy M, Hazar A , Cilli A , Celenk B, Kilic O, et al. Prognosis of hospitalized patients with community-acquired pneumonia. Pulmonology. 2018;24(3):164-9. [View at Publisher] [Google Scholar] [DOI] [PMID] [View at Publisher] [DOI] [PMID] [Google Scholar]
54. Ryu S, Oh SK, Cho SU, You Y, Park JS, Min JH, et al. Utility of the blood urea nitrogen to serum albumin ratio as a prognostic factor of mortality in aspiration pneumonia patients. Am J Emerg Med. 2021;43:175-9. [View at Publisher] [DOI] [PMID] [Google Scholar]
55. Yang CJ, Chen J, Phillips AR, Windsor JA, Petrov MS. Predictors of severe and critical acute pancreatitis: a systematic review. Dig Liver Dis. 2014;46(5):446-51. [View at Publisher] [DOI] [PMID] [Google Scholar]
56. Pei G, Zhang Z, Peng J, Liu L, Zhang C, Yu C, et al. Renal involvement and early prognosis in patients with COVID-19 pneumonia. J Am Soc Nephrol. 2020;31(6):1157-65. [View at Publisher] [DOI] [PMID] [Google Scholar]
57. Li H, Liu L, Zhang D, Xu J, Dai H, Tang N, et al. SARS-CoV-2 and viral sepsis: observations and hypotheses. Lancet. 2020;395(10235):1517-20. [View at Publisher] [DOI] [PMID] [Google Scholar]
58. Oudit GY, Pfeffer MA. Plasma angiotensin-converting enzyme 2: novel biomarker in heart failure with implications for COVID-19. Eur Heart J. 2020;41(19):1818-20. [View at Publisher] [DOI] [PMID] [Google Scholar]
59. Ren D, Ren C, Yao RQ, Feng YW, Yao YM. Clinical features and development of sepsis in patients infected with SARS-CoV-2: a retrospective analysis of 150 cases outside Wuhan, China. Intensive Care Med. 2020;46(8):1630-3. [View at Publisher] [DOI] [PMID] [Google Scholar]
60. Ronco C, Reis T, Husain-Syed F. Management of acute kidney injury in patients with COVID-19. Lancet Respir Med. 2020;8(7):738-42. [View at Publisher] [DOI] [PMID] [Google Scholar]
61. Thum T. SARS-CoV-2 receptor ACE2 expression in the human heart: cause of a post-pandemic wave of heart failure? Eur Heart J. 2020;41(19):1807-9. [View at Publisher] [DOI] [PMID] [Google Scholar]
62. Zhang P, Zhu L, Cai J, Lei F, Qin JJ, Xie J, et al. Association of Inpatient Use of Angiotensin-Converting Enzyme Inhibitors and Angiotensin II Receptor Blockers with Mortality Among Patients with Hypertension Hospitalized with COVID-19. Circ Res. 2020;126(12):1671-81. [View at Publisher] [DOI] [Google Scholar]
Send email to the article author
| Rights and permissions | |
 |
This work is licensed under a Creative Commons Attribution-NonCommercial 4.0 International License. |

This work is licensed under a Creative Commons Attribution-NonCommercial 4.0 International License.

Contact us
Tel & Fax: (+98) 17-32450093
E-mail:
 goums.ac.ir
 yahoo.com